

High-Throughput Raman Process Monitoring of Downstream Protein Purification
Shaun Fraser, Shamus Driver, and Mark S. Kemper
Raman spectroscopy is a proven tool for in-line process monitoring and control. It can be used to quantify concentrations of chemical compounds online and in real-time. High-performance Raman spectroscopy, made possible by Tornado, a Bruker Company’ patented High-Throughput Virtual Slit (HTVS™), enhances Raman signal by increasing photon flux by 10x to 30x as compared to conventional Raman spectrometers. This significant advancement in technology enables faster measurements, lower limits of detection, and/or the use of intrinsically safe lower laser power, when needed. These additional gains in spectral quality and sensitivity uniquely enable success in difficult applications, such as fast measurements of proteins of interest during both upstream and downstream bioprocessing.
Downstream processing refers to the recovery and the purification of biosynthetic pharmaceuticals from biological sources, such as a fermentation broth. Of particular interest is the production and purification of therapeutic monoclonal antibodies (mAb). This market is projected to reach a value of USD 350 billion by the end of 2027. The downstream portion of the process typically accounts for 50–80% of the production costs of mAb therapeutics (Farid, 2007; Gavara, Bibi, Sanchez, Grasselli, & Fernandez‐Lahore, 2015) in those cases where the mAb purification platforms involve at least two to three chromatographic and filtration steps (Fahrner et al., 2001; Low, O’Leary, & Pujar, 2007).
Sensors for pH, conductivity, pressure, optical density, and single wavelength UV spectroscopy are widely implemented in chromatographic purification processes. The data from these sensors are of limited usefulness because they cannot provide detailed molecular information. The resultant lack of specificity restricts insight into product and impurity characterization and concentrations. High Performance Liquid Chromatography (HPLC) is often used to provide complementary quantitative information, but significant time is required to obtain the requisite data, and the delay associated with this measurement modality is therefore usually not sufficient for the needs of the process.
Raman spectroscopy is emerging as a technique for real-time measurements for in-line downstream process measurements. Raman can quantify multiple products and impurities simultaneously with measurement times taking seconds instead of minutes. As indicated above, the Tornado, a Bruker Company HyperFlux™ PRO Plus (HFPP) Raman spectrometer delivers considerable improvement in the Signal-to-Noise Ratio (SNR) compared to conventional Raman spectrometers due to its patented HTVS™ technology. Use of the HFPP as a monitoring tool results in faster and more accurate quantification of protein elution profiles from chromatographic separation processes. The exceptional increase in spectral throughput due to the HTVS™ results in fast measurement times coupled with high quality spectra.
This allows quantitative and qualitative characterization of proteins of interest in real time. This, in turn, provides the user with actionable information, which facilitates accurate process control. Given that downstream processing accounts for a significant fraction of protein production costs, advanced control at this stage has the potential to yield substantial, outsized improvements in profitability.
Experiment and Data Analysis
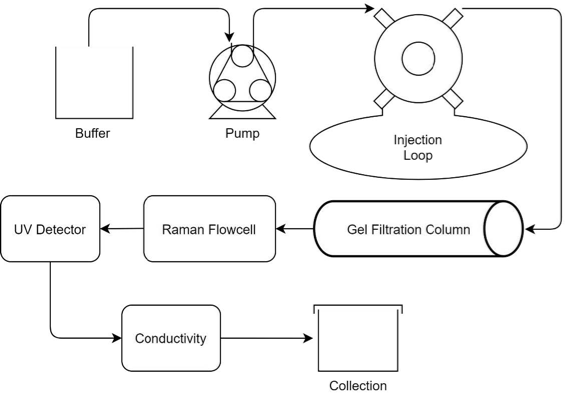
Figure 1: Process flow diagram for the experimental setup. The Raman Flowcell has been inserted post-column and before the UV detector.
To highlight the benefits of High-Throughput Raman spectroscopy for downstream protein purification, an ÄKTA™ Start system was interfaced to a Tornado, a Bruker Company HyperFlux™ PRO Plus Raman spectrometer. To facilitate in-line flow measurements, the HFPP was equipped with a standard flow cell configuration coupled to an immersion probe for Raman measurements. A process diagram illustrating the measurement setup can be seen in Figure 1.
Raman collection parameters – Representative Raman spectra were collected every 45 seconds (3000ms per exposure x 15 averaged exposures per spectrum). The ÄKTA™ Start system’s built-in UV detector (260nm absorbance) was used to correlate elution times with the data from the HFPP.
Column standards and reagents – The eluting solvent for the column was a buffer consisting of 25 mM sodium phosphate and 150 mM NaCl at a pH of 7.5. A HiPrep™ 16/60 Sephacryl™ S-200 HR 120 mL column was used for gel filtration separation. Lyophilized Cytochrome C (CytC) (Sigma Aldrich) and lyophilized BSA (Sigma Aldrich) were the proteins used for this experiment.
Preparation of samples and gel filtration – 25 mg of BSA and 12.5 mg of CytC were dissolved in 5mL of 25 mM sodium phosphate and 150 mM NaCl buffer. Before sample injection, the system was primed and equilibrated at 0.5 mL/min for a total volume of 1.2 column volumes. The CytC/BSA sample was loaded into a 2mL sample loop and injected onto the column at a flowrate of 0.5 mL/min. Complete elution of BSA and CytC occurred after 95 mL of elution.
Results
To predict the concentrations of CytC and BSA during elution, a quantitative calibration model was developed using separate preparations of CytC and BSA at concentrations ranging from 0.25 mg/mL to 4.5 mg/mL. Figure 2 shows the spectra for BSA, CytC and buffer. The main spectral region of interest ranged from 900 cm-1 to 1500 cm-1, which is highlighted in the inset in Figure 2. A Partial Least Squares (PLS) quantitative model was constructed with PEAXACT analysis software (S-Pact GmbH). The spectra were pretreated with a rubber band subtraction, 19-pt smoothing, and SNV normalization. Based on the statistical attributes of the model, protein concentration was determined with an error of 0.109 mg/mL and 0.070 mg/mL for BSA and CytC, respectively.
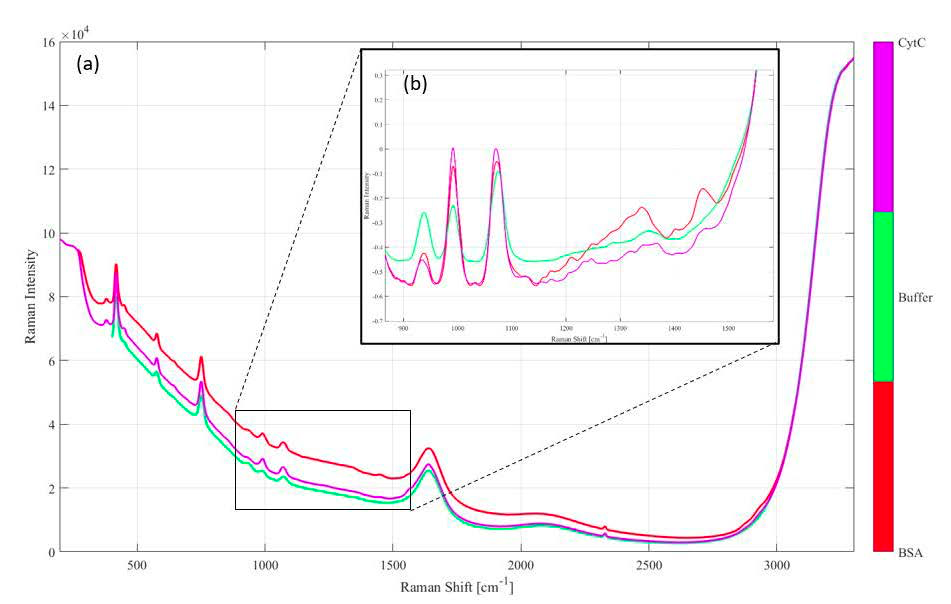
Figure 2: (a) Raw Raman spectra of 5 mg/mL BSA in gel buffer (red), 2.5 mg/mL CytC in gel buffer (purple) and gel buffer (green). The region of interest (900-1500 cm-1) is further pre-processed and expanded in the inset (b), showing peak increases and shape changes in bands (amide II band ~1500 cm-1, amide III ~ 1300 cm-1) that are consistent with an increase of protein (G. Socrates, 2001).
Conclusion
The data and analyses presented in this report show that Raman analysis using the Tornado HyperFlux™ PRO Plus can predict the chromatographic elution concentrations of individual proteins with a high degree of specificity. This quantitative analysis was successfully applied while monitoring the purification of BSA and Cytochrome C. The superior spectral performance made possible with HTVS™ resulted in fast and accurate measurements for the quantification and characterization of proteins of interest in real time. This capability provides the user with actionable information to facilitate improved process control. For example, Raman monitoring can be used to optimize protein collection in a downstream scenario, which would improve process efficiency, yield, and purity. This, in turn, would maximize profitability. The HyperFlux™ PRO Plus is a powerful tool for monitoring downstream protein purification process quality. The HyperFlux™ PRO Plus equipped with HTVS™ technology produces highly detailed chemical information, and does so faster, with better signal-to-noise ratios and lower limits of detection compared to all other process Raman instruments on the market. The HFPP can be used to establish optimal purification end points, detect process excursions with root cause determinability, enhance process understanding and control of the manufacturing process, and increase yields and profitability.
References
Farid, S. S. (2007). Process economics of industrial monoclonal antibody manufacture. Journal of Chromatography B, 848(1), 8–18. https://doi.org/10.1016/j.jchromb.2006.07.037
Fahrner, R. L., Knudsen, H. L., Basey, C. D., Galan, W., Feuerhelm, D., Vanderlaan, M., & Blank, G. S. (2001). Industrial purification of pharmaceutical antibodies: Development, operation, and validation of chromatography processes. Biotechnology and Genetic Engineering Reviews, 18(1), 301–327.
Gavara, P., Bibi, N., Sanchez, M., Grasselli, M., & Fernandez-Lahore, M. (2015). Chromatographic Characterization and Process Performance of Column-Packed Anion Exchange Fibrous Adsorbents for High Throughput and High Capacity Bioseparations. Processes, 3(1), 204.
Low, D., O’Leary, R., & Pujar, N. S. (2007). Future of antibody purification. Journal of Chromatography B, 848(1), 48-63.
Monoclonal antibody THERAPY market Size, share & amp; industry analysis, by TYPE (Human monoclonal Antibody, humanized monoclonal Antibody, chimeric monoclonal antibody, AND Murine Monoclonal ANTIBODY), by Application (CANCER, autoimmune diseases, and others), by distribution Channel (Hospital Pharmacy retail pharmacy, and Online PHARMACY), and Regional Forecast, 2020-2027. (2020, May). Retrieved from https://www.fortunebusinessinsights.com/monoclonal-antibody-therapymarket- 102734
Socrates, G. (2001). Infrared and Raman characteristic group frequencies: Tables and charts. Chichester etc.: John Wiley & Sons.
