

Improving quality, efficiency, and chemical process economics using HyperFlux™ PRO Plus real-time reaction monitoring
The HyperFlux PRO Plus Raman spectrometer for real-time process monitoring of chemical reaction kinetics enables reaction condition optimization, analysis of chemical conversion rates, and identification of optimal reaction end-points.
Chemical production and processing is an essential part of modern life and the foundation of numerous industries including pharmaceutical, petrochemical, food & beverage, specialty chemical, and bioprocessing. Continuous in-line realtime measurements can ensure quality, improve efficiency, and enhance economy compared to off-line testing of samples extracted from a process. However, in-line real-time measurements can be challenging to obtain with enough speed and accuracy to be useful. The superior performance of Tornado Spectral System’s HyperFlux PRO Plus Raman spectrometer helps overcome these limitations, making it an ideal solution for chemical reaction monitoring in production line and laboratory settings. A major pharmaceutical company needed to monitor the conversion of benzoic anhydride to the corresponding ester. Due to the exothermic nature of the reaction it was important to track the reaction progress and reaction kinetics but extracting samples from the reactor was not practical given the chemistry and conditions of the reaction. A HyperFlux PRO Plus 785 was used to monitor the reaction in-situ in real-time.
Experimental Conditions
A 50 gram quantity of benzoic anhydride was dissolved in 700 mL of methanol in a reaction vessel and was stirred for a short period. A solution of methanolic HCl (20 mL HCl in 100 mL methanol) was then added slowly to avoid an extreme exothermic reaction. The vessel was then sealed and the mixture was allowed to react. A Hyperflux Pro Plus with 785 nm excitation laser was used with an immersion probe inserted into the reaction vessel. Spectra were collected for a period of 7 hours using 1 second exposures and averaging 10 exposures per spectrum. The Panorama software from LabCognition was used for data display and trend analysis.
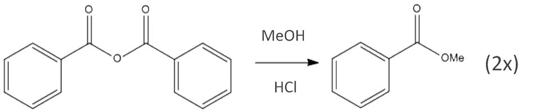
FIGURE 1: Alcoholysis of Benzoic Anhydride
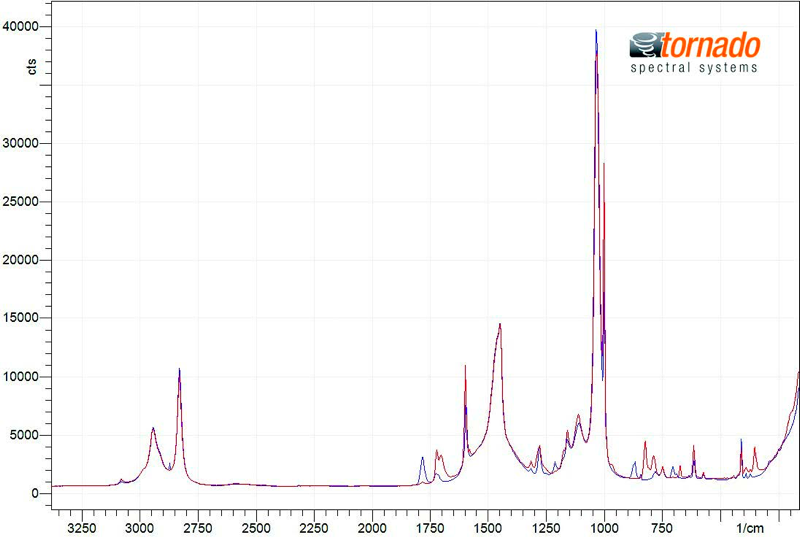
FIGURE 2: Overlay of starting material (blue) and end product (red) spectra
Results & Discussion
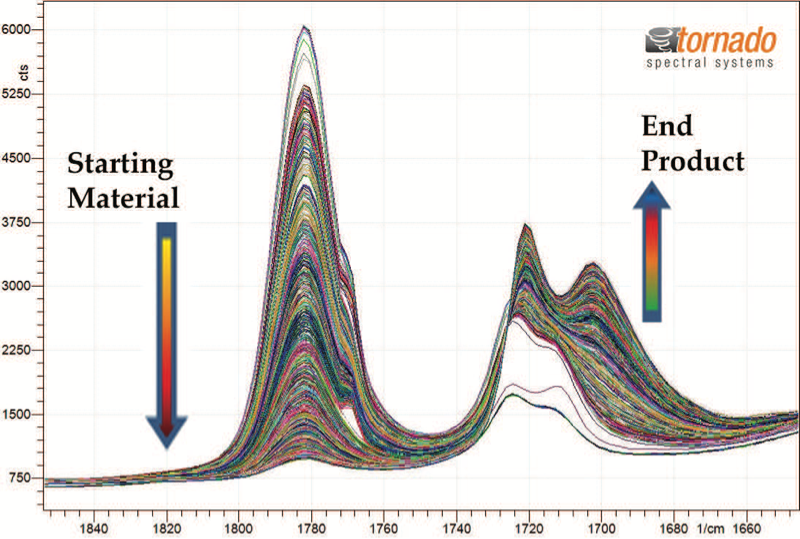
An overlay of the collected spectra for the starting material (blue) and end product (red) is shown in Figure 2 and the progression of spectral changes over the range of interest is illustrated in Figure 3. Spectral intensity variation is observable in a number of discrete spectral ranges. The changes are most evident within the range of 1840 to 1630 cm-1. The consumption of the starting material reactant is directly related to the reduction in the peak area in the range of 1820 to 1745 cm-1 and two overlapping peaks in the spectral range of 1740 to 1631 cm-1 indicate the generation of the end product. As illustrated in Figure 4, the rates of starting material consumption (red trend line) and end product formation (green trend line) were calculated from the change of the above peak intensities over time. The trend analysis was used to identify the optimal reaction end time to maximize end product formation while minimizing process time.
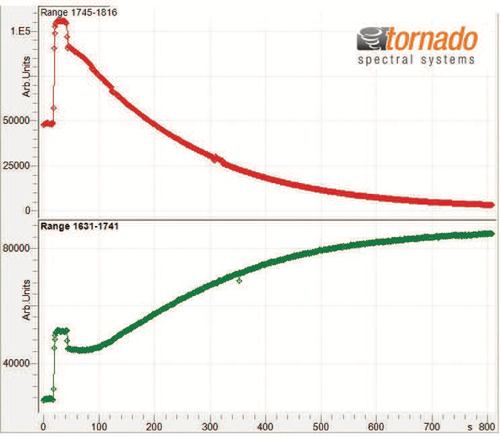
FIGURE 4: Trend line of reactant and end product
Conclusion
Tornado’s HyperFlux PRO Plus provided a fast and accurate monitoring tool to confirm reaction quality and optimize reaction timing. HyperFlux PRO Plus allows fast data collection for greater data density which enhances tracking process changes, determining reaction kinetics, optimizing reaction conditions, flagging process upsets, and turning batches over more quickly compared to other Raman instruments.
